前言
数据可视化就是借助图形化手段将原本冷冰冰的数据生动的传达给用户。用户能够轻松的获取有价值的数据并及时的做出相应的决策支撑。
目前接触到的数据表示形式有一下几点:
1、表格
2、常见的统计图行(柱状、条形、饼图、折线,雷达等)
3、关系图(连通图)
那么有哪些技术可以轻松的帮助我们对以上需求进行处理呢?
1、jQuery的datatables
2、ECharts、D3.js
3、cytoscape.js
正文
jQuery的DataTables
表格是一种常见的数据组织形式。对标的部门应该是财务部吧,因为财务每天都要接触大量的报表。企业数据部门从数据库抓取相关数据进行一系列的运算处理将数据以报表的形式提供给财务部门是一种常见的需求形式。
原先是如何制作表格的呢?我们知道html中有一个table标签,这个是我实习前接触最多的关于表格功能的解决办法。但是table标签使用是非的麻烦需要我们手动的组装dom。并且table不够灵活,往往对一些常用的需求(对每列进行求和,排序,分页,数据导出)的解决比较麻烦。
那么请尝试使用jQuery的datatables吧。
它提供灵活和强大的api。
使用
引入css和js文件
1
2
3
4
<link rel="stylesheet" type="text/css"
          href="https://cdn.datatables.net/v/bs/jszip-2.5.0/dt-1.10.16/b-1.4.2/b-html5-1.4.2/datatables.min.css"/>
    <script type="text/javascript"
            src="https://cdn.datatables.net/v/bs/jszip-2.5.0/dt-1.10.16/b-1.4.2/b-html5-1.4.2/datatables.min.js"></script>
在相关的前端界面声明一个table标签
注意table标签中的内容是可选的,也就是说thead tbody 这两个标签是可选的。
1
2
<table class="table b-t"  id="t1">
</table>
js文件中对datatables进行初始化操作
1
2
3
4
5
6
7
8
9
10
11
12
13
14
15
16
17
18
19
20
21
22
23
24
25
26
27
28
29
30
31
32
33
34
35
36
37
38
39
40
41
42
43
44
45
46
47
48
49
50
51
52
53
54
55
56
57
58
59
60
61
62
63
64
65
66
67
68
69
70
71
72
73
74
75
76
77
78
79
80
81
82
83
84
85
86
87
88
89
90
91
92
93
94
95
96
97
98
99
100
101
102
103
104
105
//最基本的样子
$('# t1').ready(function(){
    $('#datatables').dataTable({
    ...
    });
    }
)

//一个工作中的例子
//一定注意以下列设置中的对象数组中每个对象的data属性的值一定要和数据库查询出来的列名对上!
oTable = $('#sales-details').DataTable({
            "ajax": {
                //请求数据
                url: "/api/brand/sales",
                //数据返回格式
                dataType: 'json',
                //请求方式
                type: 'get',
                //请求携带参数
                data: {
                	...
                },
                //对返回的数据进行处理,其中可以出发其他的一些数据可视化的工具,比如说echarts。对于要展示的数据,对其进行return。
                dataSrc: function (data) {
                    if (data.tag === 'success') {
                        //data对象中的detail属性的值是我们想要展示在datatables上的。
                        return data.details;
                    } else {
						BootstrapDialog.show({
							title: '服务器返回错误',
							message: data.message.toString()
						});
                        return [];
                    }


                },
                //错误处理
                error: function(error){
                    BootstrapDialog.show({title: 'Error', message: JSON.stringify(error)});
                }
            },
            //绘制结束触发的回调
            "fnDrawCallback": function (oSettings) {
                ...
            },
            "processing": false,
            "iDisplayLength": 100,
            "aaSorting": [[6, "desc"]],
            //国际化操作
            "oLanguage": {
                "sLengthMenu": "显示 _MENU_ 记录",
                "sEmptyTable": "未有相关数据",
                "sInfo": "当前显示 _START_ 到 _END_ 条,共 _TOTAL_ 条记录。",
                "sInfoEmpty": "当前显示0到0条,共0条记录",
                "sInfoFiltered": "(数据库中共为 _MAX_ 条记录)",
                "sSearch": "模糊查询:",
                "bDeferRender": true,
                "sUrl": "",
                "oPaginate": {
                    "sFirst": "首页",
                    "sPrevious": " 上一页 ",
                    "sNext": " 下一页 ",
                    "sLast": " 尾页 "
                },
                "oAria": {
                    "sSortAscending": " - click/return to sort ascending",
                    "sSortDescending": " - click/return to sort descending"
                }

            },
            'dom': '<"float_left"B><"float_right"f>rt<"float_left"i><"float_right"p>',
            //数据导出
            "buttons": [{
                extend: 'csv',
                text: '导出csv',
                className: 'btn btn-info',
                charSet: "utf8"
            }, {
                extend: 'excel',
                text: '导出excel',
                className: 'btn btn-info'

            }],
            //列设置
            "aoColumns": [
                {"sTitle": "城市", "data": "city_name"},
                {"sTitle": "店铺", "data": "store_name"},
                {"sTitle": "地址", "data": "address"},
                {"sTitle": "商品", "data": "goods_name"},
                {"sTitle": "购买量(散装)", "data": "amount"},
                {"sTitle": "购买金额", "data": "asum"},
                {"sTitle": "送达时间", "data": "arrived_time"},
            ],
            //特殊列数据处理 对第7列(从0开始)的值进行时间的格式化
            "aoColumnDefs": [
                {
                    'aTargets': [6], 'mRender': function (data) {
                        return moment(data).format('YYYY-MM-DD HH:mm:ss');
                    }
                }
            ]

        });
以上是关于jQuery的datatables的简单的使用。
表格底部新增总计
 首先在table体中加上tfoot
1
2
3
4
5
6
7
8
9
10
11
12
13
14
15
16
17
18
19
20
21
<table id="sales-details"
               class="table-condensed font-small table-hover table-striped dataTable no-footer" cellspacing="0"
               width="100%">
            <tfoot>
            <tr>
                <th>合计</th>
                <th></th>
                <th></th>
                <th></th>
                <th></th>
                <th></th>
                <th></th>
                <th></th>
                <th></th>
                <th></th>
                <th></th>
                <th></th>
                <th></th>
            </tr>
            </tfoot>
</table>
在option中新增一个footerCallback:写上一个回调函数。
1
2
3
4
5
6
7
8
9
10
11
12
13
14
15
16
17
18
19
20
21
22
23
24
25
26
27
28
29
30
31
32
33
34
35
36
37
38
39
40
41
42
43
44
45
46
47
48
49
50
51
52
53
54
55
56
57
58
59
60
61
62
63
64
65
66
67
68
69
70
71
72
73
74
75
76
77
78
79
80
81
82
83
84
85
86
87
88
89
90
91
92
93
94
95
96
97
98
99
100
101
102
103
104
105
106
107
108
109
110
111
112
113
114
115
116
117
118
119
120
121
122
123
124
125
126
127
128
129
130
131
132
133
134
135
136
137
138
139
140
141
142
143
144
145
146
147
oTable = $('#sales-details').DataTable({
            "ajax": {
                url: "/",
                dataType: 'json',
                type: 'get',
                data: {
                    start_date_no1:$('#start-date-no1').val() ||'',
                    end_date_no1:$('#end-date-no1').val() || '',
                    cityIds:$('#city-select').val() ||''
                },
                dataSrc: function (data) {
                    if (data.tag === 'success') {
                        echart9_data = data.data;
                        return data.data;
                    } else {
                        BootstrapDialog.show({
                            title: '服务器返回错误',
                            message: data.message.toString()
                        });
                        return [];
                    }
                },
                error: function(error){
                    BootstrapDialog.show({title: 'Error', message:error.toString()})
                },
                 complete: function (oSettings) {
                    //console.log('wantu.....');
                     //draw_echart9(echart9_data);
                 },
            },
            "processing": false,
            "iDisplayLength": 100,
            //默认对第7列进行降序排
            "aaSorting": [[6, "desc"]],
            "oLanguage": {
                "sLengthMenu": "显示 _MENU_ 记录",
                "sEmptyTable": "未有相关数据",
                "sInfo": "当前显示 _START_ 到 _END_ 条,共 _TOTAL_ 条记录。",
                "sInfoEmpty": "当前显示0到0条,共0条记录",
                "sInfoFiltered": "(数据库中共为 _MAX_ 条记录)",
                "sSearch": "模糊查询:",
                "bDeferRender": true,
                "sUrl": "",
                "oPaginate": {
                    "sFirst": "首页",
                    "sPrevious": " 上一页 ",
                    "sNext": " 下一页 ",
                    "sLast": " 尾页 "
                },
                "oAria": {
                    "sSortAscending": " - click/return to sort ascending",
                    "sSortDescending": " - click/return to sort descending"
                }
            },
            'dom': '<"float_left"B><"float_right"f>rt<"float_left"i><"float_right"p>',
            "buttons": [
            ],
            "columns": [
                {"sTitle": "城市", "data": "cityName"},
                {"sTitle": "实际GMV", "data": "gmv"},
                {"sTitle": "GMV目标", "data": "gmvGoal"},
                {"sTitle": "GMV月目标", "data": "gmvMonthGoalShow"},
                {"sTitle": "GMV完成率", "data": 'gmvPercent'},
                {"sTitle": "实际毛利额", "data": 'profit'},
                {"sTitle": "毛利额目标", "data": 'profitGoal'},
                {"sTitle": "毛利额月目标", "data": 'profitMonthGoalShow'},
                {"sTitle": "毛利额完成率", "data": 'profitPercent'},
                {"sTitle": "实际净利润", "data": 'netProfit'},
                {"sTitle": "净利润目标", "data": 'netProfitGoal'},
                {"sTitle": "净利润月目标", "data": 'netProfitMonthGoalShow'},
                {"sTitle": "净利润完成率", "data": 'netProfitPercent'}
            ],
            "aoColumnDefs": [
                {
                    'aTargets': [],
                    'mRender': function (data) {
                        return (data * 100).toFixed(2) + "%";
                    }
                },
            ],
            "footerCallback":function(row, data, start, end, display){
                var api = this.api(), data;
                // Remove the formatting to get integer data for summation
                var intVal = function ( i ) {
                    return typeof i === 'string' ?
                        i.replace(/[\$,]/g, '')*1 :
                        typeof i === 'number' ?
                            i : 0;
                };
                var goalToal = {};
                var actual = {};
                var  i =1;
                for (i;i<=12;i++){
                    //实际总计
                    if(i===1||i===5||i===9){
                        pageTotal = api
                            .column( i, { page: 'current'} )
                            .data()
                            .reduce( function (a, b) {
                                a=parseFloat(a)||0;
                                b=parseFloat(b)||0;
                                return intVal(a) + intVal(b);
                            }, 0 );
                        actual[i] = pageTotal;
                        $(api.column(i).footer()).html(
                            pageTotal
                        )
                    }
                    else if(i === 2||i===6||i===10){
                        pageTotal = api
                            .column( i, { page: 'current'} )
                            .data()
                            .reduce( function (a, b) {
                                a=parseFloat(a)||0;
                                b=parseFloat(b)||0;
                                return intVal(a) + intVal(b);
                            }, 0 );
                        goalToal[i] = pageTotal;
                        $(api.column(i).footer()).html(
                            pageTotal
                        )
                    }
                    else if(i ===4 ||i ===8||i=== 12){
                        $(api.column(i).footer()).html(
                            Math.round((1+((actual[i-3]-goalToal[i-2])/(Math.abs(goalToal[i-2])))).toFixed(4)*10000)/100
                            +'%'
                        )
                    }
                    else{
                        // Total over this page
                        pageTotal = api
                            .column( i, { page: 'current'} )
                            .data()
                            .reduce( function (a, b) {
                                a=parseFloat(a)||0;
                                b=parseFloat(b)||0;
                                return intVal(a) + intVal(b);
                            }, 0 );
                        // Update footer
                        $( api.column( i ).footer() ).html(
                            pageTotal
                            //+' ( '+ total +' total)'
                        );
                    }
                }
            },
        });
复杂表头需求
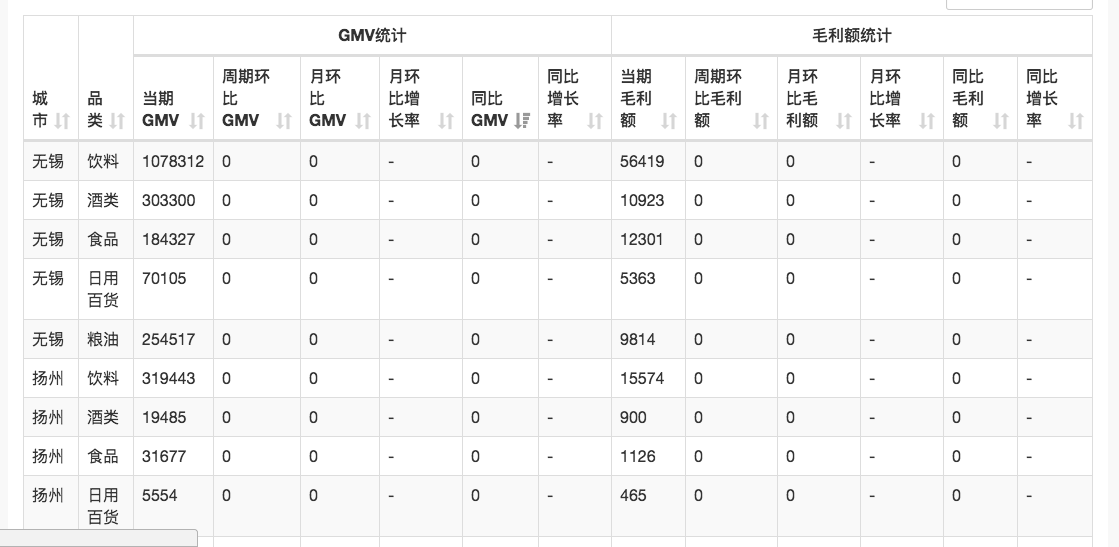 其实就是在表头改动一下就行了:
1
2
3
4
5
6
7
8
9
10
11
12
13
14
15
16
17
18
19
20
21
22
23
24
25
26
27
28
29
30
 <table id="buyAndSaleTable" class="table table-striped table-bordered table-hover" cellspacing="0"
                       width="100%">
                    <!--table table-striped table-bordered table-hover-->
                    <!--table-condensed font-small table-hover table-striped dataTable no-footer-->
                    <thead>
                    <tr>
                        <!--rowspan纵向合并 colspan横向合并-->
                        <th rowspan="2" style="text-align: center">城市</th>
                        <th rowspan="2" style="text-align: center">品类</th>
                        <th colspan="6" style="text-align: center">GMV统计</th>
                        <th colspan="6" style="text-align: center">毛利额统计</th>
                    </tr>
                    <tr>
                        <th>当期GMV</th>
                        <th>周期环比GMV</th>
                        <th>月环比GMV</th>
                        <th>月环比增长率</th>
                        <th>同比GMV</th>
                        <th>同比增长率</th>
                        <th>当期毛利额</th>
                        <th>周期环比毛利额</th>
                        <th>月环比毛利额</th>
                        <th>月环比增长率</th>
                        <th>同比毛利额</th>
                        <th>同比增长率</th>
                    </tr>
                    </thead>
                    <tbody id="buyAndSale">
                    </tbody>
                </table>
小结
说说自己的使用的疑惑,一开始使用觉得初始化的东西太多了,记都记不住。但是希望你明白一个道理,先使用它做个demo看看。 国际化操作那一块,我个人是没有记的,每次都是直接copy过来使用。其他地方熟能生巧。相信会很快上手。